Yesterday I received an email letting me know that Colleen Dilenschneider and her colleagues at IMPACTS Experience had released a new post titled Ticket Purchasing Frustrations Are On the Rise. (subscription required) I knew this would be a topic I wanted to write on.
An hour later, I get an email from someone who knows I have a subscription asking if I had read the piece. In turn, people had emailed him knowing of his interest in the topic asking if he read it.
Clearly I needed to address this post sooner than later, but I had a lot of meetings and wasn’t able to digest the piece. I don’t usually post on Thursdays, so here is a bonus post for you all.
The second paragraph of the piece reads:
Think twice before assuming that this article merely points out areas for independent ticketing systems to improve! These hassles may in fact be the fault of cultural organizations themselves.
That is pretty much what the research has found. Some of the issues are due to the design of the ticketing system, but a lot of the problems originate with organizational policies and procedures.
As usual, the data is broken down between exhibit based and performance based arts and cultural organizations. While the frustration is rising for both groups, the negative attitudes have increased most for exhibit based organizations – especially those with timed entry tickets.
According to the data Dilenschneider and IMPACTS present, reported barriers related to the ticket purchasing experience between 2015 and 2018 were pretty low and stable. Once the pandemic hit, ticket purchasing moved toward the forefront as an issue.
The barrier value of “Hard to purchase/transact” skyrocketed…That’s an increase of 146%! In this span of years, we experienced many more potential visitors saying that it was just too hard, complicated, confusing, or inconvenient to purchase a ticket to make it worth the effort.
[…]
But you’ll notice another alarming jump in “difficult to purchase or transact” as a driving barrier just last year! Today, this barrier is approaching the 100 index value threshold wherein the sector risks losing attendance and people are choosing to do something else because of ticketing-related issues…
Timed entry is an additional frustrating factor for visitors to exhibit based entities. Attendees would rather enter when they are ready rather than during a specific window. There is also a concern about committing and then having kids get sick, scheduling conflicts pop up, being delayed by other factors.
Obviously, these are concerns people have when attending performing arts events too, but it seems that since the requirement to show up at a specific date and time has long been part of the process, it isn’t as big a barrier. Though it does still present a barrier as people are increasingly able to have the experience they want on their schedule.
While being difficult to purchase or transact certainly remains a modest barrier to attendance, it’s not a prohibitive barrier for many performing arts organizations. At the end of the day, performing arts programs have long been date and time specific. As a result, guests are habituated to selecting a timed and dated ticket.
Also, as performing arts leaders know well, some programs and performances secure more patrons than others. Attendance to performing arts organizations is especially dependent on how interested folks are in the specific programming. Therefore, it may come as no surprise that far greater barriers to attendance for performing arts institutions are simply preferring an alternative leisure activity.
One thing that plagues both exhibit based and performing arts entities roughly equally is the data entry burden. People don’t like to have to enter all their information in a number of boxes. If they have to hit next to go to a new page rather than fill everyone out on one screen that adds to the frustration.
If they have to fill out a marketing questionnaire as part of the process that can present a deterrent. (my emphasis)
As explained above for exhibit-based organizations, it’s not uncommon for some institutions to “throw in another question to collect data, while we’re at it!” From additional questions ranging from how someone heard about the organization, to their length of stay in the city, to asking if they’d like at attend or qualify for an additional event, to any number of additional queries requiring a response or even a “next” click, organizations benefit by contemplating the potential negative impact of holding up the transaction. It may seem quick and easy to add on an additional question or two (with internal benefit, no doubt) from the view of a staff member, but these are a rapidly growing annoyance for potential patrons.
The takeaway isn’t to avoid collecting helpful information from patrons, but to consider how doing so may impact the transaction experience.
They point out that many consumers are used to doing a one click purchase on Amazon which allows them to skip entering information into different fields…and leaves the customer feedback survey until after the transaction is complete.
As I always write in connection with these posts based on data IMPACTS has crunched I am only summarizing part of the whole. They also cover factors like pricing confusion that can be associated with packages, discount eligibility, and dynamic pricing; availability of payment types; digital ticketing; and purchasing interface on desktop vs mobile.

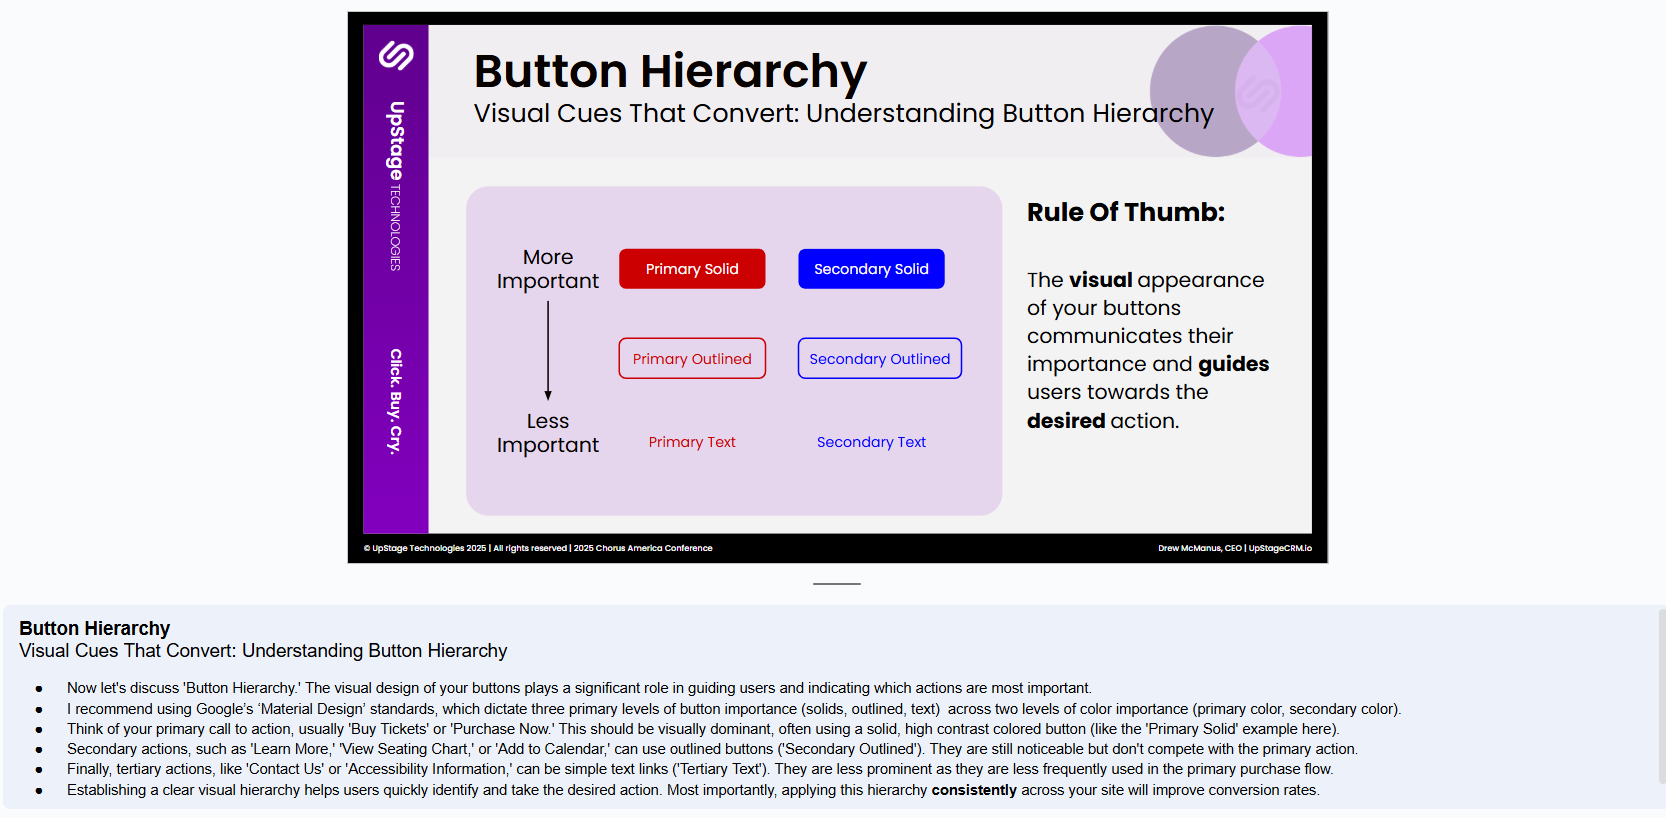

Yes, we have been undergoing a review of websites to make sure there are good contrasting colors for people. Since…