As I promised in my last post, I took a deeper look at the Culture Track reporting over the weekend. More specifically, I took at a look at both the Top Line deck and Supporting Data documents which are available for download. I didn’t review the raw data.
The Supporting Data document is presented with visual graphs which makes it easy to interpret. Though I also hungered for some analytical commentary from the Culture Track folks about what the greater implications might be.
A few observations from Supporting Data in the hopes of making the opportunity to dig in irresistible for readers.
First of all, the charts seem to belie the idea that Millennials are abandoning cultural experiences. Except for watching TV (which includes streaming) they lead in every category. This is only one of three pages.

Now you may be saying, sure but participation once a year isn’t a high hurdle.
However, that generation also leads in frequency per month too.
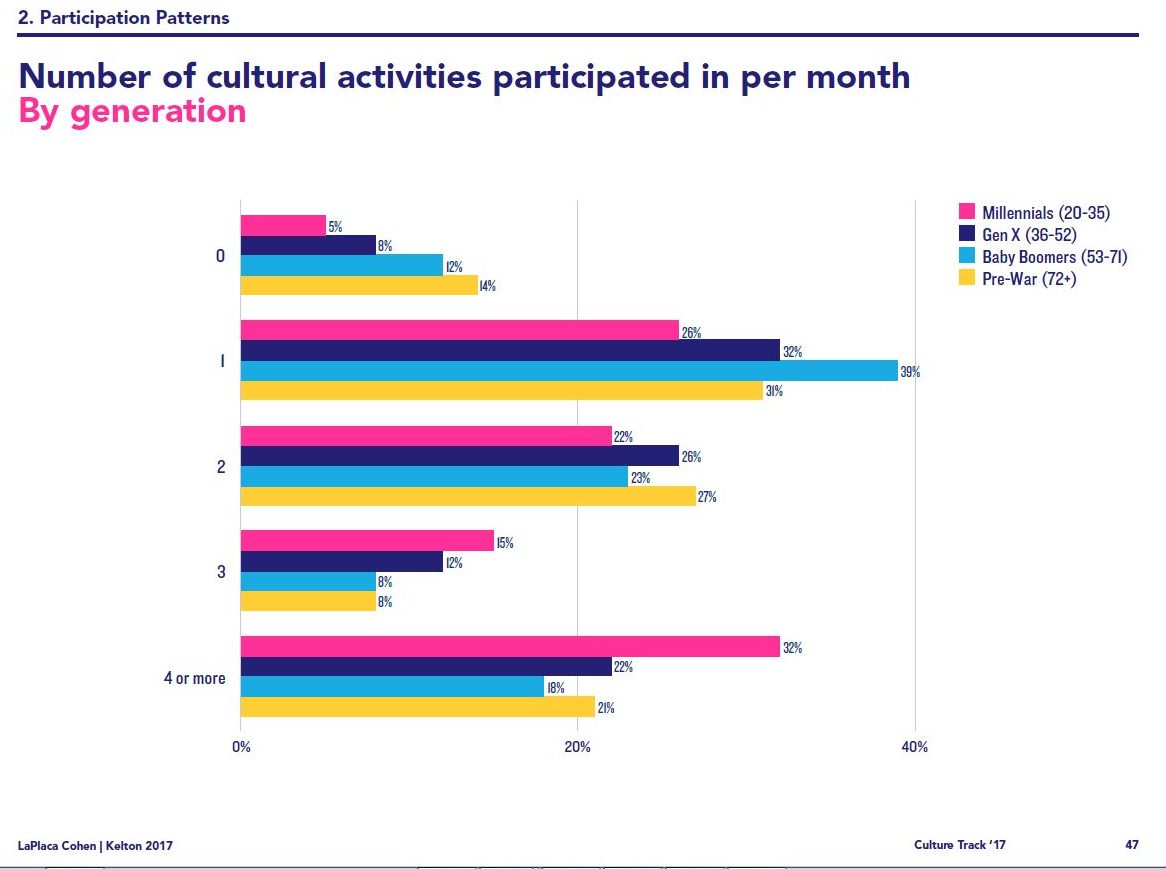
If you remember what I quoted and wrote last week about the perceptions of those who were high frequency attenders, this has some important implications.
People who attend three or more cultural experiences per month are 94% more likely to cite “it doesn’t change” as a barrier to more frequent cultural participation compared those who attend one or fewer cultural experiences per month.
Given that what people define as a cultural experience is pretty broad, the chances that your average attendee is participating in three or more experiences a month is pretty good. Being 94% more likely to feel lack of change is a barrier to participation is pretty significant.
While you shouldn’t take all this information at face value without digging in and questioning the basis of the findings, the fact the data depicted may contradict your assumptions can be enough to get conversations started reevaluating long held beliefs.
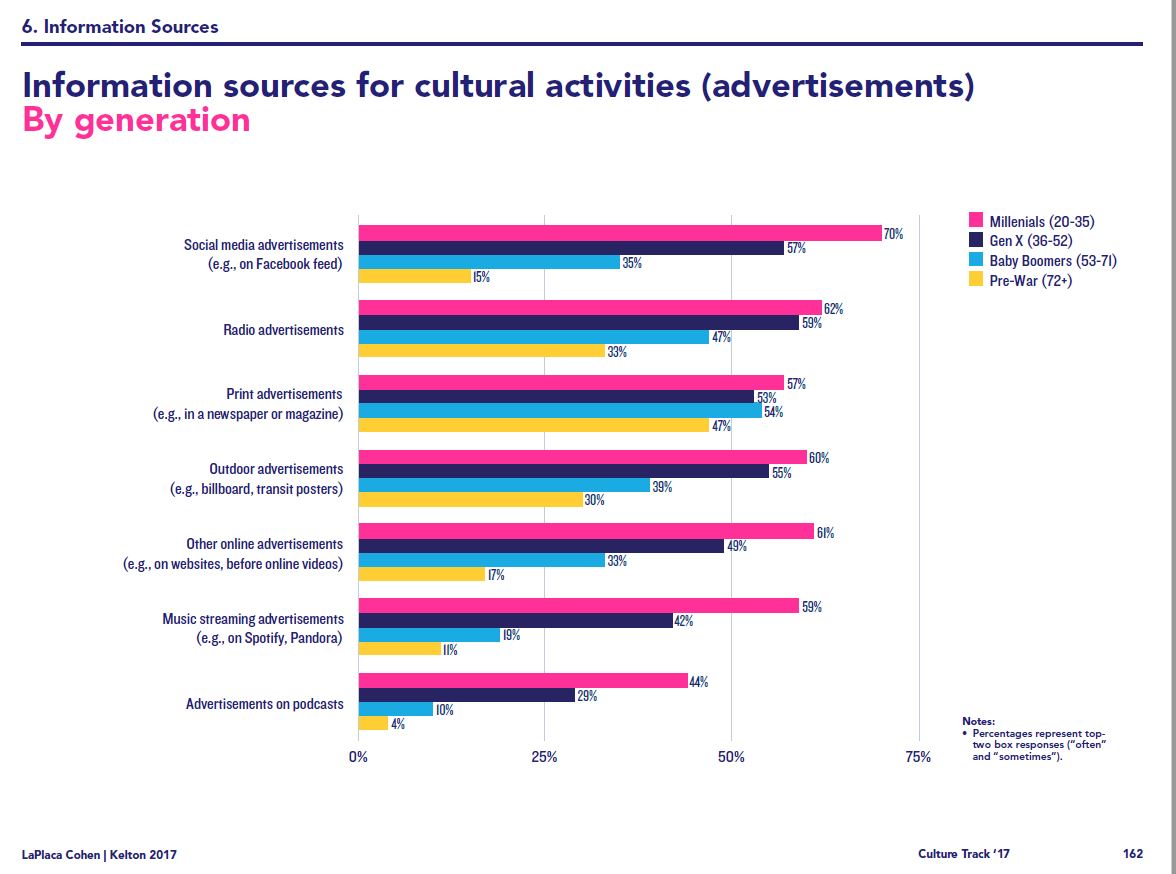
The study authors slice and dice the data through a number of different lenses which make for interesting viewing. Most every question is presented in terms of generation, race/ethnicity, community size, education level, marital status and parental status.
So for example, the following information about where people get advertised and non-advertised information about cultural activities is presented in these contexts. (There is also a chart for offline information sources which I haven’t included)

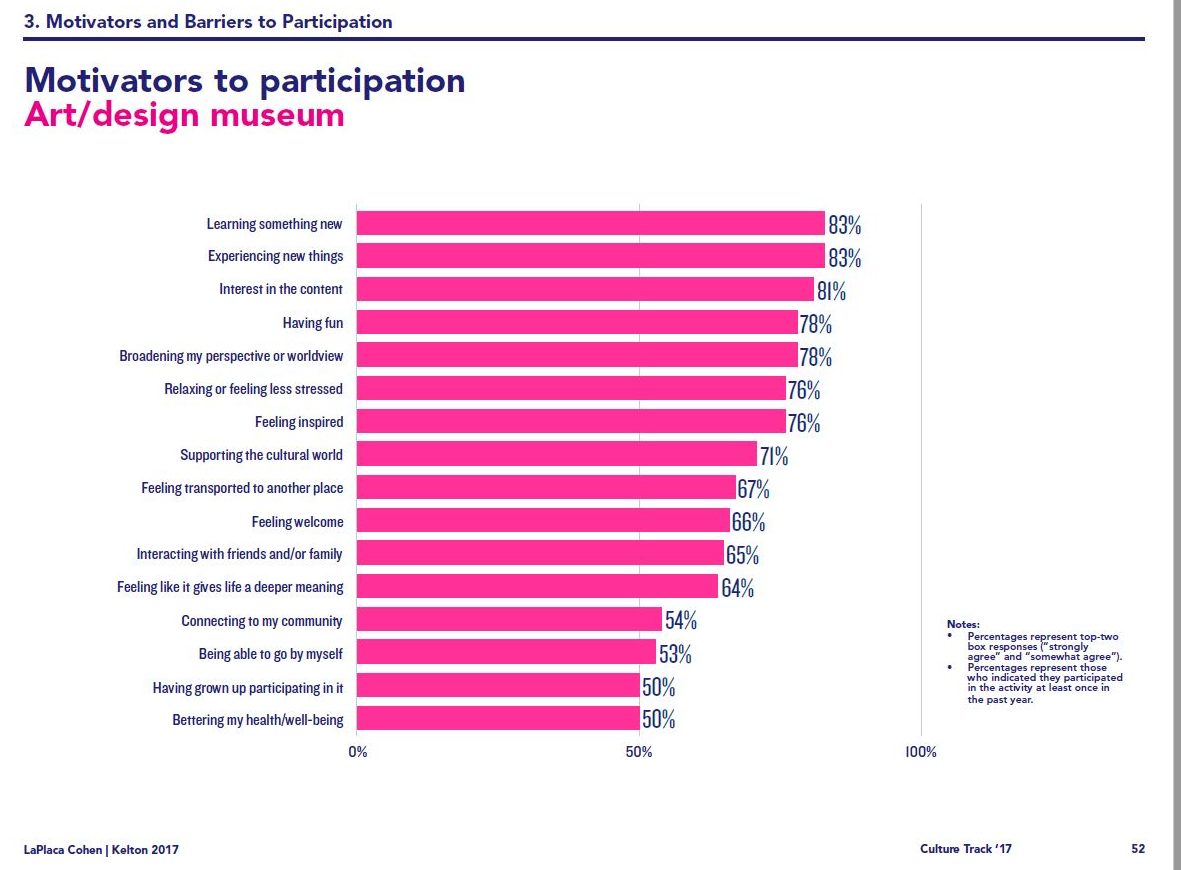
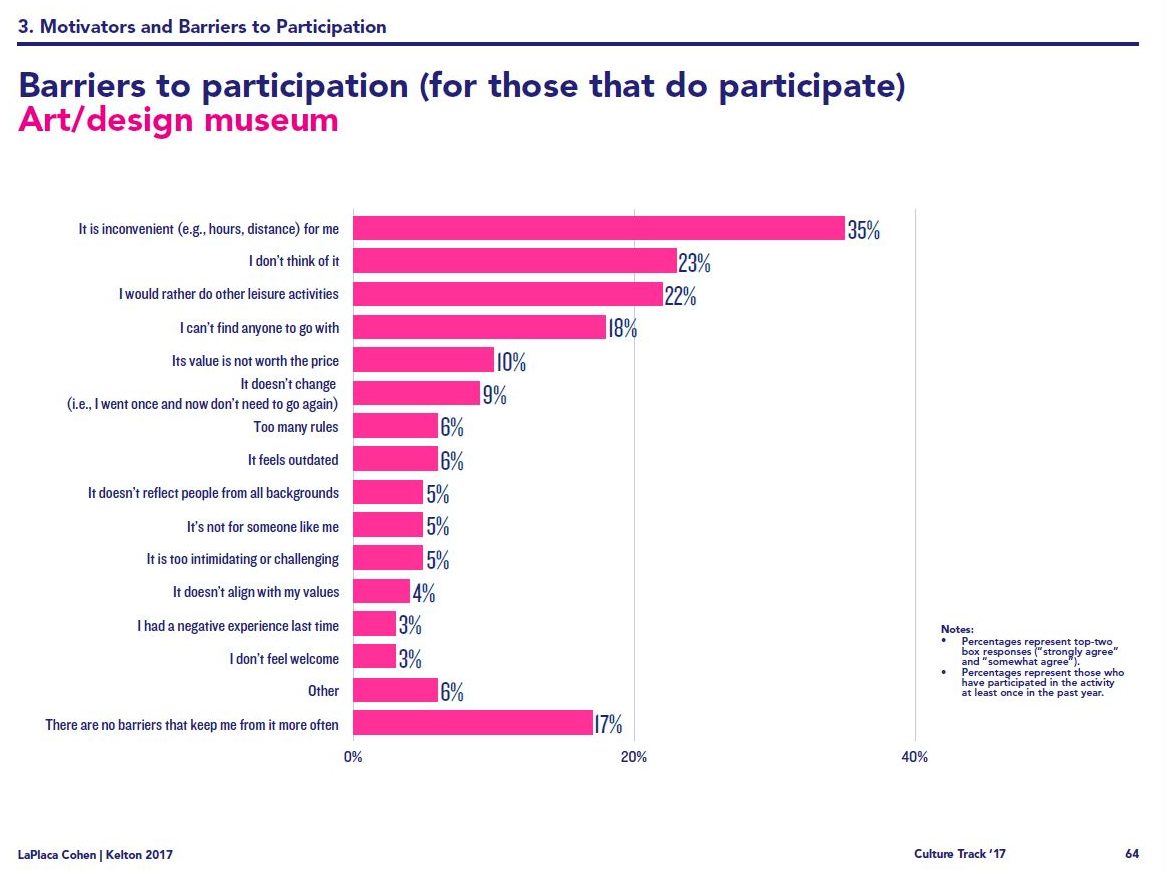
Perhaps of most interest to different arts and cultural organizations, they break down motivators and barriers for participation for 12 different disciplines/cultural activities.
Below is a sample for art museums. There is also a chart with barriers for non-participants for each area.